


Sign up for the Powder & Bulk Solids Weekly newsletter.
Image Analysis: A New View of Particle Characterization
Mark Bumiller,
June 19, 2008
11 Min Read
.svg?width=850&auto=webp&quality=95&format=jpg&disable=upscale "Image Analysis: A New View of Particle Characterization")
|
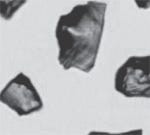
Figure 1: Sharp-edged, abrasive particles |
Image analysis is becoming an increasingly popular tool for particle-size and -shape analysis of powders. The use of manual microscopy for particle characterization is nothing new and remains a common practice in many labs in many industries. The first halting attempts at image analysis began in the mid-1980s, when custom systems were designed using components including a microscope, camera, frame-grabber card, and software written by the end-user. Development accelerated in the mid-1990s, with rapidly enhanced computer power and improved digital cameras. Modern image analysis systems for particle characterization are capable of analyzing tens of thousands of particles in a matter of minutes with sensitivity down to below 1 µm.
Why Image Analysis?
The microscope has always been the referee technique in particle characterization because it is accepted as the most direct measurement of particle size and morphology. Automating manual microscopy has been driven by the desire to replace a tedious, somewhat subjective measurement with a sophisticated technique for quantifying size and shape of a sufficient number of particles to assure statistical confidence with the end result. Analysts performing manual microscopy tend to describe particle shape using language such as round, blocky, sharp, fibrous, etc. By assigning numerical values to various shape descriptors, image analysis systems provide numerical distributions of well-defined shape parameters (defined later in this article).
Morphology Data. Particle shape influences the bulk behavior of the powder as well as numerous performance characteristics. Powder flows more easily with spherical particles than when the aspect ratio approaches the shape of a fiber. It is easy to visualize how powder compaction for particles shaped like tennis balls would vary from those shaped like hockey pucks. Abrasive particles with sharp edges would wear a work piece more quickly than rounded particles.
High Resolution. Any technique that analyzes individual particles is inherently a high-resolution technique. The most popular technique for particle-size analysis is probably laser diffraction. While image analysis can resolve two peaks separated by only a few microns, laser diffraction requires the second peak to be twice the size of the first for baseline resolution. Image analysis is also better capable of finding a second smaller population outside of a main distribution. The ability to detect the presence of a few large particles outside of the main distribution has proven useful in several industries where the larger particles cause problems with product performance.
Particle Images. Although statistically valid distributions of defined size and shape parameters are the primary results from image analysis, pictures of the particles can also prove invaluable. Looking at images of the particles analyzed can answer the following types of questions: Are those larger particles individual or agglomerates of many smaller ones? Are there any fibers present in the sample? Do I think this particle is contamination from the measurement process itself? The images are also useful for allowing the analyzer to reject particles from calculated distributions based on direct observation and judgments best made by the human mind. Visual inspection of particles can sometimes lead to some kind of identification, such as contamination versus product.
Dynamic versus Static Image Analysis
|
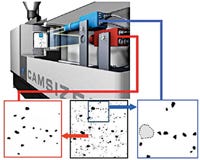
Figure 2: Dynamic image analysis (Image courtesy of Retsch Technologies) |
Two distinct development paths have emerged with time. They differ in how the sample is introduced to the measurement zone: In dynamic image analysis, particles flow past one or more cameras. In static image analysis, particles sit on a slide moved by an automated stage for inspection by camera and microscope. Schematics for the two approaches are shown in Figures 2 and 3.
|
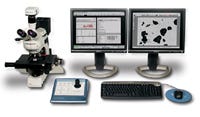
Figure 3: Static image analysis (Image courtesy of Clemex Technologies) |
Although both approaches have been successfully implemented into many industrial applications, dynamic image analysis generally has lower sensitivity than static systems and has moved into the QC environment, while static image analysis systems provide greater sensitivity and operate on more-sophisticated software for more-complex investigations.
Many basic functions operate the same with either approach: Particles are presented to the measurement zone, images are captured with a digital camera (CCD), the particles are separated from the background, various size and shape parameters are assigned to each particle viewed, and a result report is generated. Additional features built into modern image analysis software include the ability to automatically separate two particles touching each other, filling holes, smoothing or removing small protuberances, separating overlapping acicular objects, and keeping track of incomplete objects in a field in order to recombine them once all fields are analyzed.
Data Generated
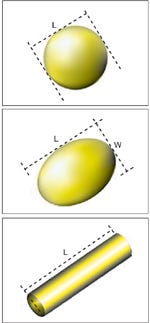
Number versus Volume Distributions. Image analysis generates both particle size and shape distributions. The particle size distribution is initially built as a number distribution since this is a counting technique. The software then has the ability to transform the number into a volume distribution, which is the preferred format for most industries. As shown in Figure 4, when using the PSA300 static image analysis software, the two-dimensional projected area converts into a volume distribution assuming several particle shapes:
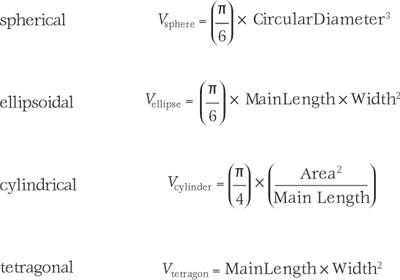
Conversion from number to volume distribution based on the proper shape model reduces errors, especially as aspect ratios deviate from near unity.
|
Figure 4: Sphere, ellipsoid, and cylinder models |
Shape Parameters. Particle morphology can be described through various representational calculations. Unfortunately, due to a current lack of standardization, not all software packages define shape the same way. A simple example is the concept of aspect ratio. Televisions are changing from the older 4:3 aspect ratio to 16:9 with the advent of high definition. Rather than using an x:y expression, particle morphology is typically described as either some longest dimension divided by some shorter dimension, or short divided by long. The former creates a wide range of numerical possibilities while the latter limits the values between one and zero. Even when considering only length/width, possible definitions include longest diameter/shortest diameter, longest diameter/diameter perpendicular to the longest diameter, longest Feret diameter/shortest Feret diameter, etc.
Defining how much a particle deviates from a circle or sphere is another example where multiple definitions can obfuscate data interpretations. But in general, a value of 1.0 defines a circle, and smaller values (0.9, 0.8, etc.) indicate deviation from sphericity. Other calculations describe surface roughness, string length, fractal dimension, and other particle characteristics.
Industrial Application: Dynamic Image Analysis, Size and Roundness of Glass Beads
Camsizer dynamic image analysis systems are currently used at several sites to investigate the size and morphology of glass beads used for highway paint where the qualities of the beads have a significant impact on retroreflectivity performance. The glass beads should be round and clear, with little scatter or filtering. The more perfectly round the bead, the more the light reflects back to its source, providing visibility of the marking in low-light conditions. A perfect sphere without air inclusions gives the best retroreflectivity. The types of defects normally found in beads fall roughly into the following categories:
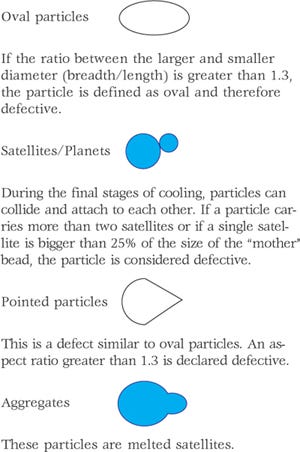
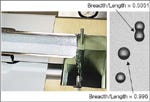
Automated dynamic image analysis is replacing the older techniques of sieving and manual microscopy for particle size and the Round-o-Meter for particle morphology, providing more information quicker and more reproducibly. Figure 5 shows glass beads flowing into the measurement zone on the right and example data to the left. The breadth/length ratios for the single particles are dramatically different than the aggregated particles. Dynamic image analysis provides highly reproducible size and shape data that can be used to track the manufacturing process and define product quality.
Industrial Application: Dynamic Image Analysis, Size and Shape of Extruded Catalyst
|
Figure 5: Measurement of glass beads on the Camsizer |
For effective catalytic reactions with a high yield, it is important to have a large surface area of the catalysts and enough free volume in the reactor to achieve a high throughput—the more volume is occupied by the catalyst, the less reactant can be introduced to the reactor. The ratio of catalyst surface and reactant volume is crucial for controlling the reaction kinetics. Elongated or extruded catalysts provide improved pressure drop in fixed-bed reactors while also providing high surface area.
|
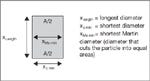
Figure 6: Determining the shape of extruded particles |
For elongated catalysts, size and shape distributions provide useful information on both manufactured quality and performance prediction. Size analysis has to provide information on width, length, and length distribution, as well as the amount of dust (or fines) in the sample.
The shape of these extruded particles can be described as shown in Figure 6.
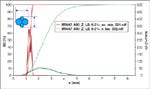
Many catalyst extrudates have a trilobe or quadralobe cross section (Figure 7). Using the xc min or xMa min size definition, it is possible to distinguish between the two different diameters of the quadralobe extrudates. They are reflected in the two maxima of the bimodal xc min or xMa min distribution seen in maroon in Figure 8, where the length distribution is shown in green.
Industrial Application: Static Image Analysis, Fiber Length and Aspect Ratio
|
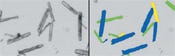
Figure 9: Raw image of fibers, and after separation |
To date, the majority of static image analysis systems have been used in the pharmaceutical industry for applications ranging from excipient qualification and active-ingredient characterization to supporting laser diffraction method development. Experiences in the pharmaceutical industry measuring fiber-shaped crystals led to the development of a unique algorithm that improves accuracy when defining the length and shape of fibers. Older algorithms would either define crossed fibers as x-shaped particles, or break the fibers into four or five segments. Using this new algorithm, the PSA300 separates crossing fibers as individual particles and assigns each one accurate size and shape parameters. This is the first image-analysis system capable of proper characterization of fibers or elongated crystals—a very important control issue in the pharmaceutical and other industries. This is accomplished by measuring the slide at multiple points along the vertical, or z, axis, in order to determine which fiber sits upon another. The software then reconstructs each fiber and assigns length, width, and aspect ratio values to each fiber. Figure 9 shows a slide containing multiple fibers. The image to the left shows the initial image, before thresholding or particle separation. The image to the right shows how the separations have been performed by the unique algorithms.
Conclusion
Image analysis has become one of the fastest-growing techniques for particle characterization in both R&D and routine quality control applications. Improved computing power, digital camera technology, and software development have transformed automated image analysis into not only a smart replacement for manual microscopy, but also a valuable standard particle characterization tool in many industries.
Mark Bumiller is vice president of particle products at Horiba Instruments. After graduating from Carnegie Mellon University in chemical engineering, he has worked in the field of particle characterization for more than 20 years, including in product design, technical support, and management. He has served on the board of the International Fine Particle Research Institute and the Particle Technology Forum in the American Institute of Chemical Engineers. Bumiller can be reached at 508-366-5664 or [email protected].
About the Author(s)
You May Also Like
Editor's Choice


.svg?width=800&auto=webp&quality=80&disable=upscale)