Particle Size Distribution Measurement in Fluidized Beds
December 13, 2010
By Jörg Westermann, Mark Bumiller
|
Figure 1: Particle images |
Fluidized bed technology provides one possible method to achieve particle size enlargement, creating desired physical properties such as improving powder flow and dust elimination. This is typically achieved through the addition of an aqueous binder forming liquid bridges between the primary particles. To solidify the binder bridges the solvent needs to be removed by a drying process. The fluid bed technology is one possibility to combine both agglomeration and drying in a single apparatus. This technology can be used either for batch operation or in continuous operation mode, depending on the product specification, throughput, or production costs. Fundamental knowledge of the relationship between governing process parameters and the resulting product properties is desired for the design of production plants. Such knowledge can be implemented in simulation models, providing a framework to support the plant design.
|
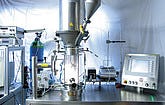
Figure 2: Fluidized bed reactor |
Many attempts have been made to describe the process of agglomeration in fluidized beds in terms of the continuous population balance approach (1,2).
Population balance equations (PBE) describe the temporal change of particle property distributions. As a result, one obtains the temporal change of the particle number distribution with respect to selected particle properties, which are called the internal coordinates.
The most demanding part of applying PBE to agglomeration is the choice of the kinetics in terms of an agglomeration kernel. For the one-dimensional PBE, where the particle volume v represents the internal coordinate, the kernel is given as the product of the agglomeration efficiency and a size-dependent expression.
|
Figure 3: Camsizer analyzer |
The influence of process conditions such as flow rate of gas, temperature, and binder concentration on the kinetics of spray agglomeration process was investigated for two materials, highly porous alumina oxide and non porous glass beads (see Figure 1). A lab scale fluidized bed (Figure 2) was utilized for this study. A sample port was attached to the chamber approximately to withdraw particles from the fluidized bed. The temporal evolution of particle size distribution was measured offline by means of a Camsizer dynamic image analyzer (Figure 3).
|
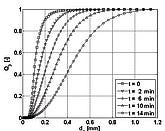
Figure 4: Camsizer data |
The measuring principle of the analyzer is based on the analysis of images captured by two cameras as particles fall down in front of a light source. The wide dynamic range of the instrument allows for analysis of particles in a range from 30 µm to 30 mm so that extensive growth progressions during the agglomeration progress can be clearly displayed. The analyzer uses two high-resolution CCD cameras for the simultaneous analysis of particle size and particle shape. The basic camera (CCD-B) analyzes every large particle in the sample, whereas the zoom camera (CCD-Z) registers the small particles with higher resolution. The contact-free optical measurement is carried out in real time and provides all required information about particle size and shape simultaneously. The samples are fed to the measurement chamber via a vibratory chute (width 60 mm) that was optimized for fragile fluidized bed agglomerates during the feeding in order to avoid the mechanical destruction.
|
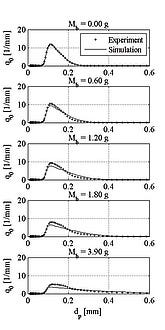
Figure 5: Theory vs. experimental |
The analysis of the experimental data in terms for dynamic evolution of particle size distribution has shown that the process conditions have a significant impact on the product properties. Particle size distribution as a function of time after the initiation of the process can be tracked using the Camsizer image analyzer as shown in Figure 3.
The data acquired from the Camsizer was directly used to determine the kinetics of the growth process. It is demonstrated that some size-dependent kernels such as shear-kernel or equi-partition of kinetic energy kernel (EKE-kernel) do not preserve the temporal evolution of the size distribution. On the contrary, an empirical kernel of Kapur (3) predicts the experimental data with high accuracy, as seen in Figure 5.
Jörg Westermann, international sales manager/Vertrieb International, Retsch Technology (Hahn, Germany), can be reached at +49 2129 5561-173 or [email protected]. For more information on Retsch Technology, visit www.retsch-technology.com. Mark Bumiller, European manager for particle analysis products, Horiba Jobin Yvon S.A.S. (France), can be reached at +33 (0)1 64 54 13 00 or [email protected]. More information on Horiba can be found at www.horiba.com.
References
1. Randolf, A. and Larson, M. (1988). Theory of Particulate Processes, 2nd. ed. New York: Academic Press, 1988.
2. Heinrich, S., Peglow, M., Ihlow, M., Henneberg, M. and Mörl, L. (2002), Analysis of the Start-Up Process in Continuous Fluidized Bed Spray Granulation by Population Balance Modelling, Chem. Eng. Sci. 57, no. 20, 4369-4390
3. Kapur, P.C. (1972) Kinetics of Granulation by Non-random Coalescence Mechanism, Chem. Eng. Sci. 27, 1863-1869
You May Also Like

