Transitioning to In-Line Powder Flowability Measurement
May 21, 2019

The flow properties of powders are a topic of significant industrial interest. The flowability of intermediates routinely impacts manufacturing efficiency, for example the maximum achievable tableting rate for a pharmaceutical formulation, while for products as diverse as powder coatings, fertilizers, metal and milk powders flow properties directly influence performance, and by extension value. Numerous powder testing techniques have been developed to meet the resulting need to quantify flow properties, with dynamic powder testing, an at-line technique, demonstrating particularly high sensitivity and process relevance. Ongoing efforts to boost the efficiency of powder processing create demand for real-time powder flow characterization technology to transfer and optimally integrate effective specifications within the process environment.
This article considers the requirements for powder flowability measurement, introducing in-line technology that delivers data that are closely comparable to those produced by dynamic powder testing. The potential for complementary application of the two techniques is illustrated via experimental results.
The Importance of Powder Flowability
The importance of measuring powder flowability is most easily appreciated within the context of ensuring consistent, controlled flow/transport through a manufacturing plant. Powdered raw ingredients are typically introduced into a process from a hopper, a common source of erratic flow and sub-optimal manufacturing efficiency. Indeed, the development of a methodology to ensure consistent first in, first out hopper discharge was one of the earliest motivations for developing a more rigorous approach to powder testing. Matching the critical dimensions and materials of construction of a hopper to the characteristics of a specific powder is essential for reliable operation.
When it comes to the broader issue of powder transport, technologies range from screw extruders to pneumatic conveying systems with in-process material subject to very different environments in each case. While extruders impose a forcing flow regime, pneumatic conveying is associated with substantial aeration, the introduction of air lubricating particle-particle interactions and enhancing flowability under the prevailing low stress conditions.
Beyond its impact on powder transport, flowability also affects the efficiency of a range of different unit operations, including die-filling--a critical step in tablet production--and blending. Free-flowing powders or granules that readily release air are associated with rapid and complete die filling, and by extension the high throughput production of high-quality tablets. When it comes to blending, powders vary significantly in terms of dependence on flow rate, with many flowing more freely at higher shear rates. Powders that exhibit high flow rate sensitivity normally require high shear processing for efficient blending while those that do not, can be advantageously blended with a low shear mixer to minimize the risk of particle attrition and electrostatic charge evolution.
When it comes to product performance, flowability influences many value-defining characteristics. For instance, the impact of air on flowability, up to the point of fluidization, is significant for products ranging from dry powder inhaler formulations to fluidized bed catalysts while for others, for example, powdered foods and detergents, flowability defines ease of use. For materials such as agrochemicals a high degree of flowability may be critical for accurate dosing.
In summary, there is considerable motivation across a wide range of industrial sectors to measure powder flowability to optimize both process and product performance.
Measuring Flowability
Shear cell testing, the first scientific approach to powder testing, was introduced in the 1960s specifically to support an associated hopper design methodology. It remains popular for this purpose and is now used more generally to assess flowability. However, the technique of dynamic testing which was introduced in the 1990s has proven significantly more sensitive and relevant for flow property measurement, especially for assessing powders in a low stress state and for investigating the impact of air [1].
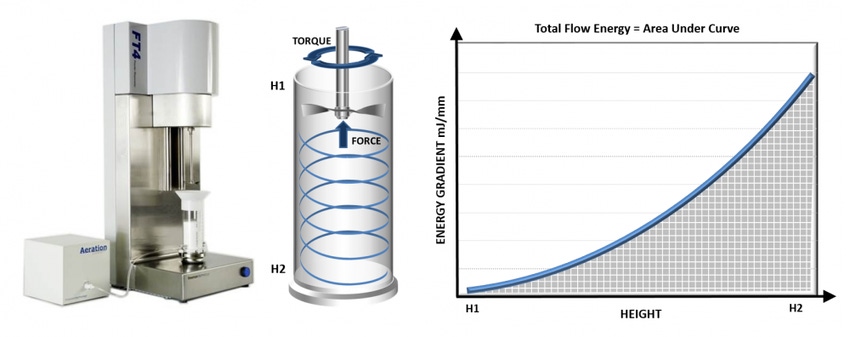
See Figure 1: Dynamic powder testing has an established track record for generating highly sensitive, process relevant data.
Dynamic powder properties are generated from measurements of the axial and rotational forces acting on the blade of an impeller as it rotates through a powder sample. A unique attraction of the technique is that it offers considerable flexibility to tailor test conditions to directly simulate the process of interest. For example, powders can be tested in a consolidated, moderately stressed, aerated or fluidized state. Furthermore, the speed of rotation of the impeller can be varied to assess flow rate sensitivity and measurements can be made during an upward or downward traverse of the impeller to assess behavior under different flow regimes. Repeat testing of the same sample provides an assessment of physical stability.
This versatility, in combination with the high repeatability and sensitivity of instrumentation for dynamic testing, underpins the value of the technique for the multi-faceted assessment of product performance and for process optimization studies. However, dynamic testing is an at-line technique. This raises the question of how dynamic property specifications might be implemented for automated monitoring and control, where the goal is to access the benefits of in-line measurement (see The Benefits of Continuous In-Line Measurement below).
An Introduction to Drag Force Flow Measurement
Drag force flow (DFF) measurement is a new technique for in-line real-time powder characterization. Like dynamic testing, it is based on measurement of the forces associated with the movement of powders. Figure 2 shows the key features of DFF sensor which can be inserted directly into a vessel or line for continuous powder flow measurement.
See Figure 2: An in-line DFF sensor measures the force associated with powder flow, in real-time.
Flow past a needle-like DFF sensor causes a deflection, the magnitude of which is measured with high sensitivity by two optical strain gauges or Fiber Bragg Gratings (FBG) mounted within its hollow core. The extent of deflection is directly related to the force exerted on the pin. This force is a function of the properties of the in-process material including the velocity of movement, particle/fluid density and/or viscosity. The evolution of the measured force as a function of time can therefore be correlated directly with process behavior. The design of the DFF sensor gives it several important advantages for in-process monitoring. For example, measurements are unaffected by electromagnetic interference or the build-up of material on the sensor (fouling), the sensor self-calibrates for temperature and there is no ignition hazard. A measurement rate of 500 Hz provides essentially continuous monitoring enabling the generation of highly repeatable data and the characterization of any periodicity associated with processes such as blending and granulation.
See Figure 3: Raw data from a DFF sensor (left) are converted into Force Pulse Magnitude (FPM) data (right).
The raw data recorded by a DFF sensor are force measurements associated with the impact of individual granules or particles. Figure 3 shows example data which in this case exhibits periodicity associated with a process agitator (rotating at 15 Hz); each peak corresponds to an agitator blade passing within the vicinity of the probe. A useful way to process these data is to plot the difference between the highest and lowest values of force measured in a specific time period to generate values of Force Pulse Magnitude (FPM) (see figure 3 - right). The time period associated with this calculation can be matched to the process and is automatically determined by the sensor software. Here, it is associated with the frequency of rotation of the agitator. FPM values have the attraction of always being positive and provide a useful metric for the evaluation of powder characteristics, though useful information can be extracted from an analysis of individual force pulses.
See Figure 4: A histogram of FPMs can be constructed from values associated with a certain time interval to generate the metrics MFPM and WFPM which can be used in combination to characterize in-process material.
FPM values can be used as a rolling average, a common approach in process control. However, it is also possible to derive further metrics for process characterization by using arrays of consecutive FPM values to produce “instantaneous” frequency histograms. The probability histogram shown in Figure 4 has been generated from 300 FPM data points gathered over a 20-secomd timeframe. Using standard statistical methods, a log-normal distribution fit can be applied to such histograms to generate two independent parameters: the mean value, MFPM, and the width of the distribution, WFPM. By advancing in very small increments of time to generate successive, overlapping histograms, as with a moving average, changes in MFPM and WFPM can be determined to monitor the evolution of a process.
In terms of practical significance, MFPM reflects average particle size or density while WFPM is a measure of diversity in the process material, and may be indicative of, for example, the uniformity of cohesivity, throughout the powder. These two metrics can be usefully ratioed (MFPM to WFPM) to determine a further parameter called the Powder Consistency Factor (PCF) which characterizes the uniformity of the flow force. For example, in a system consisting predominantly of fine particles but containing a small number of large agglomerates intermittently interacting with the probe, WFPM will be high resulting in a low PCF. The benefit of using PCF in place of WFPM is that it is a unitless parameter, normalized to MFPM, essentially to particle size. Together MFPM and PCF provide a fingerprint for a powder that characterizes both particle size and density, as well as providing further insight into properties such as cohesiveness. The following study evaluates the flow properties of various types of sugar to illustrate the use of these metrics and demonstrate the close agreement between data measured with an in-line DFF sensor and with at-line dynamic testing.
Case Study: Comparing the Flowability of Dry Powders with At-Line and In-Line Techniques
The flowability of a range of commercially available sugars was characterized at-line by measuring dynamic flow properties (FT4 Powder Rheometer, Freeman Technology, UK) and in-line using a DFF sensor (Lenterra flow sensor system, Lenterra, US). A commercial cornstarch, a common food ingredient routinely used as an anti-caking agent for sugar, was also analyzed.
Basic Flowability Energy (BFE) was measured using the standard test protocol for dynamic testing which also reports conditioned bulk density (CBD) [2]. Tests were preceded by a conditioning step to ensure that the powder was tested in a reproducible consistent state and then carried out in triplicate. The resulting data were averaged to generate values for each sample; error bars illustrate the standard deviation observed (see figure 5).
See Figure 5: BFE and MFPM values for the sugar samples show close agreement (MFPM values calculated from 200 consecutive FPM measurements taken after 30 seconds of mixing).
The DFF sensor was installed in a small volume mixer, 8mm above the upper blade of the agitator and 16mm above the lower blade. In each test, 1.6 l of sugar was loaded into the mixer, immersing the tip of the probe in the powder. Force measurements were then made at a rate of 500 per second for a period of 60 seconds, with the mixer running at a speed of 600 RPM. MFPM and PCF values were calculated using an array of 200 FPM values, recorded after 30 seconds of mixing (see Table 1/Figure 6). Three measurements were carried out for each powder; error bars illustrate the standard deviation observed.
The BFE and MFPM data are in close agreement, demonstrating identical trends and separating the sugar samples into three distinct groups. The first of these consists solely of brown sugar which has large granules and exhibits a much higher MFPM value than any other sample; BFE is similarly high. These results are consistent with the observation that MFPM values typically correlate with granule size.
A second group of granulated sugars – granulated sugar 1, granulated sugar 2, coconut palm, and caster – have closely similar MFPM and BFE values, around half that of the brown sugar. In general, BFE values for this group are overlapping within the uncertainty ranges associated with measurement. However, closer examination of the BFE data for granulated sugar 1 and coconut palm sugar reveal that both samples progressively changed as a result of repeat testing. For granulated sugar 1 BFE increases with repeat testing (3799, 4846, 5277mJ) with the BFE value measured in the third test significantly higher than the average (4641mJ). Coconut palm sugar, in contrast exhibits the opposite trend (4899, 4407, 3727mJ) and a final value substantially lower than the average (4344mJ). The reasons for these trends require further investigation but it can be argued that the final values, measured after repeat agitation/testing, should correlate most closely with MFPM values (measured after a 30s mixing) which is indeed the case. MFPM values systematically increase from sugar to sugar, in the order caster to coconut palm to granulated sugar 2 to granulated sugar 1; final values of BFE exhibit an identical trend. The observed differences in MFPM exceed the standard deviations associated with the measurement by at least a factor of five, highlighting the high sensitivity of the DFF sensor.
Finally, the two fine powders, confectioners’ sugar and corn starch, exhibit the lowest MFPM and BFE values, around an order of magnitude less than the brown sugar, with corn starch exhibiting the lowest value in each case.
See Table 1: Summary of all measurements made
See Figure 6: PCF data differentiate three sugar samples which were found to be noticeably sticky to the touch.
PCF values for the samples provide further insight into their characteristics differentiating them into two distinct groups with the confectioners’, coconut palm and brown sugars all exhibiting significantly lower values than the other samples. Cohesivity can directly influence PCF with cohesive materials tending to form a small number of relatively large agglomerates that may minimally effect MFPM but impact PCF by broadening WFPM. Lower PCF values may therefore be associated with more cohesive/tacky materials. This was certainly the case here with the three sugars with low PCF values proving noticeably sticky to the touch.
In summary, the results illustrate:
* That the DFF sensor can measure with high sensitivity and excellent repeatability to successfully differentiate the seven samples and that BFE data are equally effective for resolving flow differences between the samples.
* Close agreement between trends in the BFE data and measurements made with the DFF sensor.
* The value of characterizing powder flow behavior using multiple parameters. PCF further differentiates the samples, providing complementary insight to the MFPM data, in just the same way as multiple dynamic properties are routinely measured to build up the most comprehensive and relevant understanding of a specific powder. This highlights the potential for further correlation between additional dynamic properties and parameters generated with a DFF sensor.
Conclusion
Across powder processing industries there is a shared requirement to effectively monitor and control flowability, with real-time measurement technology offering important opportunities for the ongoing optimization of powder processes and products. Continuous, in-line monitoring offers a range of advantages for manufacturing, eliminating any requirement for sampling, while at the same time delivering a more robust data stream for automated process control. Technology that delivers data that can be securely correlated with established at-line measurements is particularly valuable since it supports the streamlined transfer of specifications from the lab into the manufacturing environment.
The data presented here show how highly repeatable and sensitive flowability data can be measured using an in-line DFF sensor and the robust correlations between such data and dynamic powder properties, which have proven application and relevance in process and product optimization studies. Effective and rigorous process control relies both on informative off-line and at-line testing strategies and on the implementation of effective monitoring to support the responsive, typically automated, manipulation of process variables. Dynamic testing, in combination with in-line measurement with a DFF sensor has the potential to meet this requirement, thereby supporting highly efficient powder processing and the manufacture of products with exemplary quality.
Laura Monington is applications specialist and John Yin is product manager, Freeman Technology (a Micromeritics company). Dr. Valery Sheverev is president, Lenterra Inc. For more information, visit www.freemantech.co.uk or lenterra.com.
The Benefits of Continuous In-Line Measurement
In-line measurement removes the requirement to extract a sample from the process for analysis. It therefore eliminates any risk of the material changing, prior to testing, automatically quantifying behavior under conditions that are most representative of the process. These are important benefits given that powder properties depend on the stress and strain rates applied. In addition, in-line instrumentation measures a far higher proportion of the process stream than is practical with sampling and off-line measurement, further boosting its ability to representatively capture the properties of in-process process material.
Along with enhanced data quality, in-line measurement typically delivers real-time data which can significantly improve the decision-making processes associated with process control, whether manual or automated. With real-time process monitoring it is significantly easier to run a process at an optimal set point, to detect and minimize the deviations that erode manufacturing efficiency, and to reduce the over-processing and downtime associated with a lack of timely process information.
These benefits explain the long-term trend towards the in- and on-line implementation of many analytical techniques. However, real-time bulk powder characterization is not yet well-established with solutions tending to fall short when judged against the criteria of relevance and sensitivity, or in terms of practicality.
References
[1] J. Clayton, Reviewing current practice in powder testing, Org Proc Res Dev 2015 19(1) pp 102-109
[2] R. Freeman, Measuring the flow properties of consolidated, conditioned and aerated powders — A comparative study using a powder rheometer and a rotational shear cell, Powder Technology, 174 (2007) 25-33.
For related articles, news, and equipment reviews, visit our Instrumentation & Control Equipment Zone
Click here for Instrumentation & Control Equipment Manufacturers
Get information or register for Powder Show Toronto, June 4-6, 2019
You May Also Like


