Controlling Powder Flowability: Exploring Correlations Between Particle Properties and Flow Behavior
The mechanisms that govern powder flowability are complex and create an ongoing challenge in predicting and controlling flow behavior.
February 4, 2021
Laura Shaw, Freeman Technology, and Jack Saad and Kara Bailey, Micromeritics Instrument Corp.
Flowability is a defining characteristic of powder intermediates and products. In manufacturing, powders with sub-optimal flow properties are a primary cause of blockages, plant shutdown, and inconsistent product quality. Equally importantly, flowability influences ease-of-use and performance for end-products as diverse as pharmaceuticals and foods, coatings, and metal powders. With the right powder tester, it is feasible to quantify and sensitively differentiate powder flowability under process-relevant conditions. But what if an improvement in flowability is required? Changing flowability calls for manipulation of the parameters that influence it, which in turn relies on understanding how different variables, particularly particle properties, impact flow behavior.
Our collective understanding of how particle properties influence the mechanisms that govern powder flow has improved dramatically in recent years, underpinned by advances in powder testing and in key technologies such as particle imaging. However, this is very much a work in progress. In this article we examine the mechanisms that define powder flowability and the application of particle characterization data to elucidate and control them.
The Mechanisms That Govern Powder Flow
Powders are three-phase systems consisting of solid particles, gas (typically air), and moisture (usually water). For a powder to flow the constituent particles must move relative to one another. The ease with which a powder flows is therefore governed by the strength of motive forces relative to those acting to restrict particle independence. In many instances the only motivation for movement is gravitational force, though clearly there are specific processes where additional motive force is applied, such as pneumatic conveying.
The strength of gravitational force is directly proportional to particle mass. Powders made up of larger, denser particles therefore tend to flow more easily than finer powders. The poor flowability of finer powders is routinely attributed to stronger cohesive forces between smaller particles but even low absolute cohesive forces may be sufficient to impede particle movement when compared to the low gravitational force that small particles are subjected to.
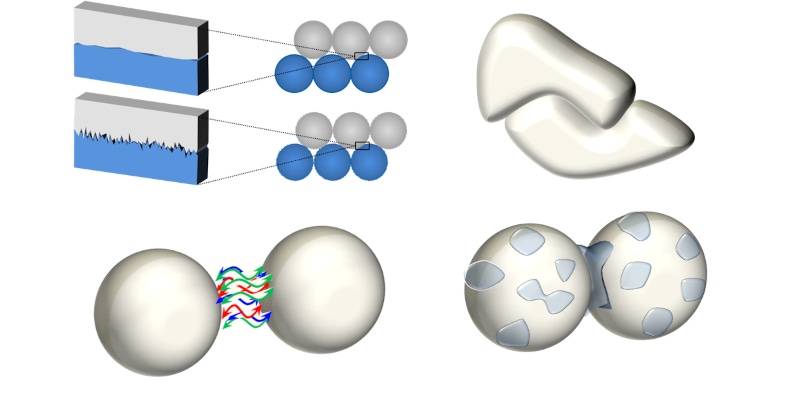
Figure 1 summarizes the interactions that may impede or restrict the movement of one particle relative to another. Frictional forces between particles (a) are strongly associated with surface texture, with smoother particles tending to slide past one another more easily than those with a higher number of contact points. Material chemistry can also influence the magnitude of frictional forces. Mechanical interlocking (b) is similarly associated with particle morphology. While regular shaped particles may move freely past one another those with an irregular, complementary shape can lock together, strongly resisting further movement.
Inter-particulate forces of attraction (c), often referred to as cohesive forces, are the result of van der Waals forces and electrostatic charge on the particle surface. These typically tensile forces hold particles close to one another and can result in particle agglomeration thereby transforming powder properties. Influenced by many factors, including chemical composition, particle size and shape, water content and processing history, cohesive forces are difficult to measure but have a defining influence on in-process behavior, particularly when powders are required to flow in a low stress, unconsolidated state such as in blending, conveying, and filling operations.
Given that many industrial powders contain low but appreciable levels of moisture, liquid bridging can also have a significant impact on flowability (d). Liquid on the surface of particles, or on the surface of process equipment, can form a bridge that reduces particle independence. In wet granulation this mechanism is exploited to engineer larger particles with enhanced flowability but often it can have the contrary effect, reducing particle mobility, inhibiting flow, and, ultimately, inducing caking. Conversely, for some powders, the ingress of moisture can improve flowability by conducting accumulated electrostatic charge, thereby enhancing mobility.
In summary, numerous properties influence flowability, by multiple mechanisms. Furthermore, for in-process materials, all four of these interactions can occur between particles and the surface or wall of processing equipment. In either situation, predicting the net result of changes in particle properties is not feasible. Measuring flowability is the pragmatic alternative, and particle property data can then be used to rationalize the observed behavior.
Measuring Flowability
Consideration of the mechanisms that govern flow behavior highlights a further, crucial point about flowability that is the influence of the conditions applied to the powder. For example, in powders where inter-particulate forces are relatively low, aeration will tend to increase the distance between particles thereby reducing the potential impact of frictional forces. Measuring flowability under conditions that simulate those of interest is therefore critical. Dynamic powder testing with a powder rheometer affords more flexibility in this regard than any other technique enabling the measurement of powders in a consolidated, low stress, or aerated state, up to the point of fluidization.
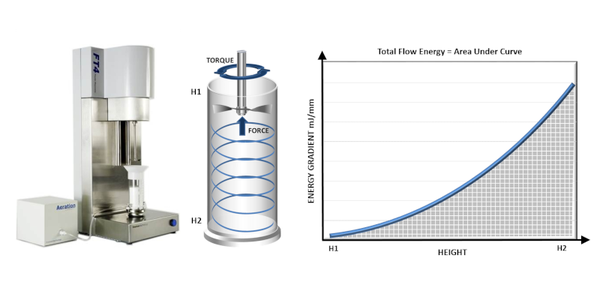
In dynamic testing, flow energy values are generated by measuring the torque and axial force acting on the blade of a powder rheometer as it rotates through the powder sample (see figure 2). Basic Flowability Energy (BFE) is measured during a downward traverse of the blade that pushes powder against the confining base of the test vessel. BFE therefore quantifies flowability under forcing conditions, as applied in a screw feeder or active feed frame. An upward traverse of the blade, in contrast, applies a gentle lifting action, generating values of Specific Energy (SE). SE quantifies the unconfined flow behavior of a powder in a low stress state, making it more relevant to processes such as gravitational filling or low shear blending. The contrasting conditions applied to measure BFE and SE make them excellent complementary flow parameters to use in studies of the impact of particle properties.
Measuring Relevant Particle Properties
Table 1 shows flow and particle properties for a sample of Brown Sugar, including Scanning Electron Microscopy (SEM) images of the particles captured at different magnifications (Phenom World ProX, ThermoFisher Scientific, Waltham, USA). BFE, SE and Conditioned Bulk Density (CBD) values were generated using an FT4 Powder Rheometer (Freeman Technology, Tewkesbury, UK). The protocols for BFE and SE include a conditioning step, a cycle of gentle agitation of the powder bed that ensures powders are tested in a consistent, homogeneously packed state, and simultaneously generate highly repeatable CBD values.
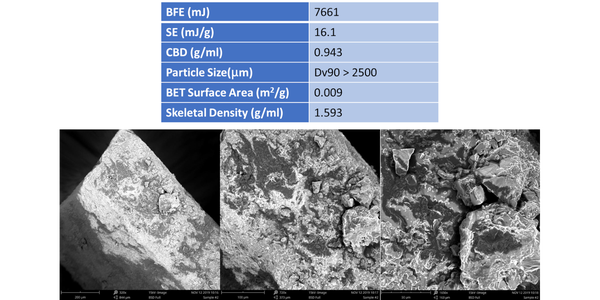
BFE and SE values for this sample are both high (see data below for comparison); CBD is also high. In efficiently packed samples with a high CBD the compressive force applied during BFE measurement transmits effectively through the powder since there is little entrained air to dampen or absorb it. As a result, the flow zone, the proportion of the bed in motion, tends to be large, generating a high BFE.
Examination of the particle properties of the sample provides further insight. Particle size data measured by light scattering (Micromeritics Saturn Digisizer II 2505) indicate that the brown sugar has extremely coarse particles, with a Dv90 > 2500µm (the upper limit for the instrument - where Dv90 is the size below which 90% of the population lies based on volume). BET surface area measured by gas adsorption (Micromeritics ASAP 2460) is relatively low, an expected result for coarse particles. Skeletal density, as measured by helium gas pycnometry (Micromeritics Accupyc II 1340) quantifies the density of the sugar particles, as opposed to the bulk density of the overall powder sample and is relatively high compared with other sugars (see below). The SEM images of this sample show particles that are angular and cuboid in shape with little evidence of significant surface roughness. This is consistent with the BET surface area data (even when normalized for particle size).
These particle property data help to explain why the forcing action imposed during BFE measurement encounters significant resistance. The large, heavy, angular particles will not move easily relative to another, despite limited frictional forces, with close packing (as evidenced from the high CBD) augmenting the stiffness of the sample. Packing efficiency is less significant in SE measurement with values dominated by the effects of mechanical interlocking and the strength of particle-particle interactions. High values of SE may therefore be associated with the shape of the particles which is not conducive to flow. However, the sample had a detectable ‘stickiness’ suggestive of strong particle-particle interactions associated with surface chemistry which would also result in high SE values.
Exploring the Impact of Particle Size
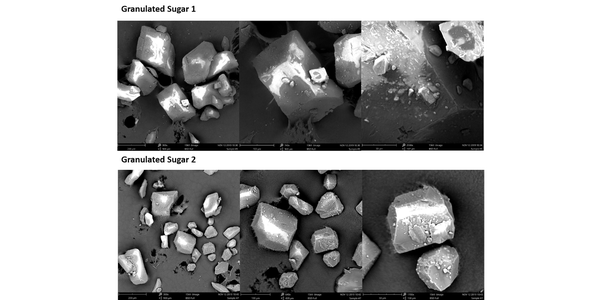
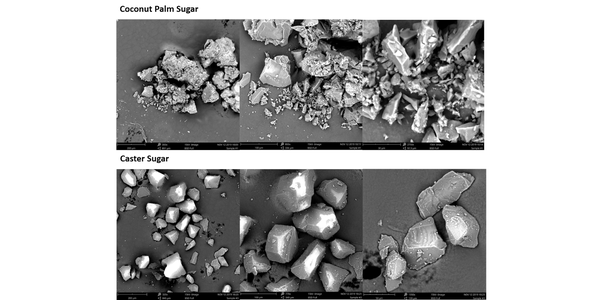
Table 2 shows flow and particle property data for a series of four different sugar samples – Granulated 1, Granulated 2, Caster, and Coconut Palm – which were characterized to explore the impact of particle size on flowability. The measurement techniques and equipment used were as for the Brown Sugar sample.
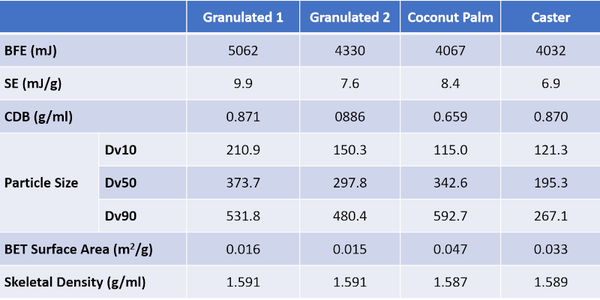
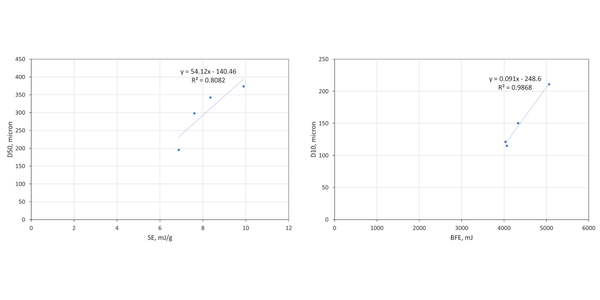
These samples are finer than the brown sugar and full particle size distribution (PSD) data can be measured by light scattering. Correlating flow properties, BFE and SE, with Dv10, Dv50, and Dv90 identifies two robust relationships (see figure 3). BFE correlates strongly with Dv10 (R2 = 0.9868), while SE correlates with Dv50 (R2 = 0.8082).
The correlation of BFE with Dv10 - and lack of correlation between BFE and Dv50 - illustrates the dangers of making simple assumptions about the impact of particle size. The coconut palm and caster sugars display comparable BFE values despite having markedly different Dv50 values, 342 c.f. 195µm respectively. The much narrower PSD of the caster sugar, relative to the coconut palm is not evident from the Dv50 data alone and there are other important differences between the samples. The coconut palm sugar has a much lower CBD, and a higher BET surface area, reflecting both the significant level of fines (as evidenced from Dv10) and the rougher, ‘cratered’ surface visible in the highest magnification SEM image.
Low CBD is typically indicative of greater cohesivity, since more cohesive powders tend to form structure within the powder bed thereby entraining air; the high SE value of the coconut palm sugar is also consistent with high inter-particulate forces. Together these data suggest that the larger particle size of the coconut palm sugar, relative to the caster, is offset by greater cohesivity and lower packing density which decrease the stiffness of the sample, reducing BFE to a lower value than might be expected from a comparison of Dv50 data. The reason for the higher cohesivity is unclear though the coconut palm sugar, like the brown, but unlike the granulated and caster sugars, exhibits detectable stickiness. The observed cohesivity may therefore be attributed either to surface chemistry or the impact of fines on the surface of larger particles.
Beyond Particle Size, Exploring the Multiple Impacts of Particle Morphology
Table 3 shows flow and particle property data for two final samples – Confectioner’s Sugar and Corn Starch – which were measured to compare the performance of samples where flowability trends with particle size run contrary to expectations. Though these samples fit with the overall trend of BFE decreasing with Dv10 - both exhibit values well below those of the four coarser sugars. The Confectioner’s Sugar has a substantially higher BFE than Corn Starch, despite having a Dv10 around half its size. With respect to the reported SE trend, the Corn Starch is somewhat consistent, but the Confectioner’s Sugar exhibits a high SE relative to its Dv50. In summary, these fine powders both deviate from the trends observed with the coarser materials.
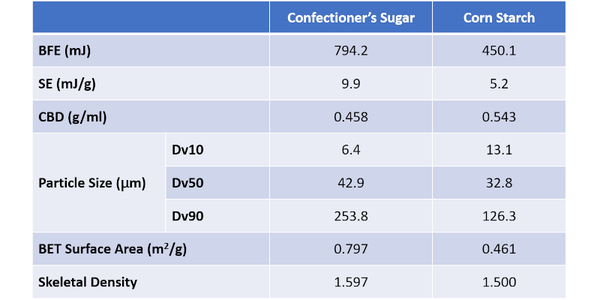
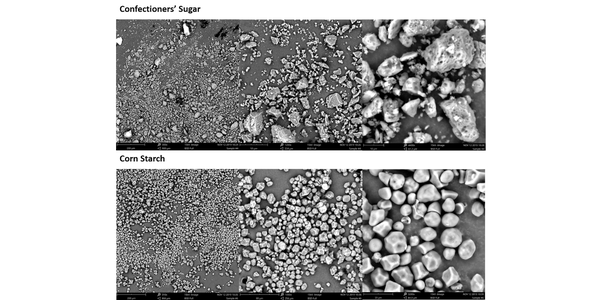
The confectioner’s sugar has an extremely low CBD, which in combination with the high SE value, suggests high cohesivity within the sample. These data suggest that BFE will be low, and it is relative to the coarser sugars, but not relative to the corn starch. PSD and BET surface area data indicate why this might be. Although the confectioner’s sugar has a lower Dv10 value, Dv50 and Dv90 are both higher than for the corn starch, which has a much narrower PSD. Looking just at PSD it is extremely difficult to assess how the flowability of the two samples might compare.
The high BET surface area of the confectioner’s sugar, almost double that of the corn starch, provides useful insight into the net effect of the differences in PSD. It suggests that the number of contact points between neighboring particles in the confectioner’s sugar will be much greater. The SEM images reveal that the morphology of the particles is also distinctly different and that the high surface area of the confectioner’s sugar reflects appreciable surface roughness, in addition to appreciable levels of very fine material. The corn starch, in contrast, is made of smooth, regularly shaped particles.
In combination these results indicate that frictional and inter-particulate forces will be relatively high in the confectioner’s sugar. In contrast, the smooth regular corn starch particles will move far more easily relative to one another. For these fine powders, such factors offset the impact of packing density providing a rationale for why the BFE of the confectioner’s sugar is higher than that of the corn starch despite its low bulk density. High inter-particulate forces similarly explain the high SE of the confectioner’s sugar.
Conclusion
The mechanisms that govern powder flowability are complex and create an ongoing challenge for those seeking to predict and control flow behavior. Advances in analytical technology, in the ability to robustly and relevantly quantify flowability, and precisely quantify the particle parameters that influence it, enable the forensic analysis of flow behavior for any given powder. The discussions presented here show how such analysis can elucidate the causes of sub-optimal flowability and help to reveal strategies to improve it to meet processing or product performance targets.
For more information on Freeman Technology (Tewkesbury, UK), visit www.freemantech.co.uk. For more information on Micromeritics Instrument Corp. (Norcross, GA), visit www.micromeritics.com.
You May Also Like


