May 29, 2018

Weighing continuously is the eyes it takes to satisfy the mind on whether process control is delivering to our expectation or not. Without the data, we are blindly shooting in ‘Blue Sky.’ When deciding on the accuracy requirements of the weighing system, consider what accuracy range is acceptable, from overkill to what you can get by with.
When continuous weigh measurement is important, determining where in the process weight measurement is possible is the next step. Some continuous weigh solutions are considerably less expensive than batch weighing into hoppers, trucks, and railcars. Consider the expense of a railcar scale compared to a $10,000 continuous weigh scale.
Shop around for manufacturers and engineers of measuring devices and control systems. Pick their brain on what the market can supply and what support they will provide. Support is just as important as the potential performance the scale system delivers. Continuous weighing is difficult. Once the current weight is known, that information is soon obsolete. The information is useless unless data is monitored and the process control is adjusting itself to the information delivered.
Over time, the industry has developed more options from which to choose. Some of those choices are dictated by the application. Retrofit applications are usually more difficult to master over new applications. The new process design can usually be worked around standard model scales. And when a scale does not exist for an application, custom design engineers may come up with a design with an acceptable outcome. We have seen designs that include an adaptive weighing system that corrects a volumetric blending signal to be corrected by the continuous weigh device. The device adjusts the volumetric signal to the volumetric blending control. This system was added without any hardware/software changes to the plant volumetric blending control. In another instance, we have seen a system that required both volumetric metering and gravimetric weighing to accomplish the job that could not be done alone, by either. Both systems have their pros and cons. The combination of both systems’ positive features was enough to get the job done that neither could have done alone. Thinking outside the box sometimes is a plus.
Applications for “weighing on the fly” include batching, blending, inventory, and truck/railcar/barge load out. Continuous weigh scale indicators display both rate and accumulated weight much like a car has a speedometer and odometer displaying miles/hour and accumulated miles. The speedometer info can be used for cruise control much like the rate signal (tn/hr, lb/min, etc.) can be used for used blending control. The rate signal is electronically smoothed (dampened) more so in blending systems than in other applications. The process is looking for a steady rate signal to help keep the process control system stable and minimize hunting.
Batching control takes advantage of the accumulated weight and will be compared to a batch set point. When both the weight and set point match, the system feed may slow the feed or shut the feed altogether. Slowing the feed first, may help to reduce over shooting the set point. A second batch set point can be used to stop the feeding. Load out applications are much like batching applications and can use the accumulated weight signal to stop the filling once a set point has been reached.
Variables in the process may affect desired performance. Air flow, excessively varying flow rates, environment, scale placement may be a factor. Material temperature, moisture, particulate size, and flowability are considerations. Material abrasiveness and hours of operation affect maintenance. The means of feeding to and discharging from the scale is part of the process. Space for a scale may be too confining for some choices.
Once a scale is placed, the scale will be calibrated under actual production conditions. The actual production conditions with all process variables takes into consideration during calibration all of the factors affecting accuracy. Material is run through the flow scale and the accumulated weight is compared to a known weight fed to the scale or collected after the scale. With this data, the rate span factor will be adjusted to a factor corrected to the material flow rate. The rate signal is integrated mathematically, which produces the accumulated weight. Rate signals and accumulated weight signal outputs are available for process control use.
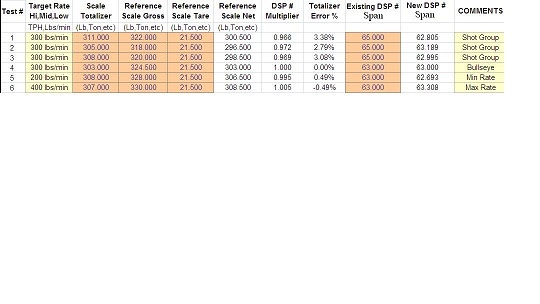
Scale repeatability is most important. It is recommended that the first three comparisons are documented with no changes to the span factor. Much like sighting in a rifle, a tight shot group is important. The reference scale net weight is divided by the accumulated scale totalizer weight and that ratio is multiplied by the existing span factor to give us the new desired span factor. If the first test results were 3.38% from the known weight, we would be happy if the following two were 2.79% and 3.08%. The average repeatability error is 3.08%. Consequently, the error shot group would be a respectable +.3%. This would be acceptable to most applications. This tells us, at one flow rate (300 lb/min), we can be very accurate. Keep in mind we may be calibrating a scale to reference scale with its own built-in error. We mention this because the calibration is dependent on the performance of the reference scale.
Now that a tight shot group has been established, we can adjust wind age and elevation to the bull’s eye. In test #4, perform the material calibration in the mid production rate range. As illustrated, the error is reduced to nothing.
Flow rates in a process can change within a certain range. Adjust the rate up (400 lb/min) and down (200 lb/min) to the minimum and maximum expected flow rates. Perform the fifth and sixth material calibration at the lower and upper production rate range. Document those tests and analyze the errors for linearity acceptability. As illustrated, the total accuracy is +.5%. Normally this is acceptable. If unacceptable, review this installation and process. If the accuracy is not acceptably linear throughout the range and the scale remains repeatable, the rate signal can be electronically profiled to make the scale performance linear. NTEP installations may require the linear profiling and/or controlling the feed rate to a specific flow.
The calibration spreadsheet illustrated is a great tool and is provided free of charge by some scale providers for documenting the above material calibration process. The spreadsheet organizes one test after another and does the error math and the corresponding new span number math. This tool comes in handy for troubleshooting problems as well.
Scale providers often supply application data sheets to collect information potential users usually don’t think about. There are nearly a dozen ways to continuously weigh. Finding your best method is your task at hand. Where do you go from here? Ask your scale provider for advice and an application data sheet.
Clarence Richard is continuous weigh control applications engineer, Clarence Richard Co., Minnetonka, MN. For more information, call 800-372-7731 or visit www.clarencerichard.com.
For related articles, news, and equipment reviews, visit our Weighing System & Scales Equipment Zone
Click here for a List of Weighing Systems & Scale Manufacturers
You May Also Like


