


Sign up for the Powder & Bulk Solids Weekly newsletter.
Michael L. Myrick
April 2, 2008
9 Min Read
.svg?width=850&auto=webp&quality=95&format=jpg&disable=upscale "Using Multivariate Optical Computing for In-Line Process Measurement of Powders and Solids")
|
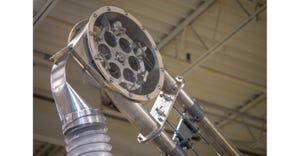
Ometric SpectrInLine Processware is a |
Manufacturing plants typically make continuous measurements of physical variables such as temperature and flow rates on their production lines. Havoc would result if plant personnel could only measure those physical variables once an hour and if they had to wait 30 minutes for the results. No one would want to guarantee product quality in such an environment. However, that is exactly the situation in most plants for the single property that most directly affects product shelf life, product quality, and production-line profitability: product composition.
Most processes require or would benefit from timely and complete knowledge of product composition. But usually “timely” and “complete” are conflicting goals: The most completeand accurate analyses of products such as sugars, meals, salts, and coals are obtained by very slow off-line laboratory measurements. While they may be used for a final quality inspection before product release or they may satisfy regulatory testing requirements, they are nearly always too time-consuming to affect production. On the other hand, fast measurements performed during production are often too inaccurate or undependable to be used for process control.
A compromise solution adopted by many manufacturing plants is to “grab” or “thief” samples of the product and analyze them in a lab near the production line using an optical spectrometer. Turnaround times in such cases range from 30 minutes to several hours. While this procedure provides production plants with data for controlling moisture, fat, protein, and several other variables, exceeding the analytical results that were possible 30 years ago, it is still far from the ideal.
Optical spectroscopy holds the most promise for bridging the gap between laboratory and in-line analysis. But optical spectroscopy instruments for measuring product composition exemplify the problem with in-line measuring: the fast ones have not been particularly good and the good ones have not been particularly fast. Photometers and spectrometers are the two types of optical spectroscopy instruments that have been available in the past. While stable, reliable, and fast, photometers are not particularly accurate in multicomponent chemical systems. While they are slower, less stable, and less reliable in manufacturing conditions, spectrometers can perform accurate analyses in complex chemical systems.
Developing a Process Control Concept
Beginning in approximately 1996, a research group began to develop a new instrumentation concept called multivariate optical computing (MOC). MOC combines the power of a spectrometer with photometer-like components. The result is instrumentation that melds the best characteristics of both types of instruments: photometer-like stability and spectrometer-like accuracy.
MOC was first publicized in 2001 (see O Soyemi et al., “Design and Testing of a Multivariate Optical Element (MOE): The First Demonstration of Multivariate Optical Computing for Predictive Spectroscopy,” Analytical Chemistry 73 [2001], 1069–1079). In 2005, Ometric Corp. (Columbia, SC) was founded to commercialize the new instrumentation and introduce it to manufacturing plants. The product line is known as SpectrInLine Processware.
The heart of MOC is an application-specific optical component called a multivariate optical element (MOE). The MOE is tailored to specific applications. These solid-state devices are fabricated using thin-film vacuum deposition techniques with in situ diagnostics for deposition control. They enable chemical measurements in real process environments.
Benefits of Real-Time In-Line Product Analysis
|
Figure 1: An out-of-spec product using a cornstarch example |
|
Figure 2: Production-line diagnostics shows moisture content of pet food following drying. |
Based on MOC, it is possible to create instruments that can endure temperature and humidity extremes, static electricity, rain and snow, washdowns, vibration, etc., providing managers and quality assurance personnel with information on their processes that was not available previously. Using MOC, it is usually possible to make chemical measurements in less than 1 second, although minute averages are adequate in many plants.
Since the SpectrInLine systems were introduced, the list of real-time analysis benefits has grown. They provide fast response to product fluctuations, reduce out-of-specification product, improve profitability, identify sources of customer complaints, offer feedback control of processes, identify production artifacts, eliminate sampling errors, characterize process drift, provide statistical analysis of processes, and measure “fast” processes. The following examples illustrate a few of these benefits.
Figure 1, which focuses on cornstarch content, details a common problem in content analysis. In this case, SpectrInLine was being used as a monitor but not as a control device. Process control was based on thief samples measured in a laboratory (the green squares in the figure). About a month after this run, a customer called to complain about the product. These data were retrieved from SpectrInLine’s server database to show that cornstarch levels were in fact well below the lower control limit for a significant period of time during the run in question. The turbidity measurements from the official thief sample showed no problems, but it was clear that one of the critical official samples might have been incorrect. That sample appeared to have been taken well before production on the line had actually started, and it was apparently exactly the same as the next official measurement. SpectrInLine’s ability to time-stamp and archive real-time data eliminates the human error component associated with sampling.
Sampling and conventional analysis miss the time-dependent behavior of a production line, knowledge of which can be important to evaluating plant performance. In the example shown in Figure 2 of moisture content in pet food, a defect was indicated by unusually high moisture levels in the product. The observed spikes were on the order of 1% moisture content, but they lasted less than a minute each. Dryer maintenance was performed, and the problem was fixed before it caused the line to shut down.
|
Figure 3: Process drift on a pet food production line: (a) moisture content as a function of time, and (b) autocorrelation of the moisture as a function of time between samples |
In pet food manufacturing, it is common to extrapolate the properties of the whole product from a measurement made on about 0.0005% of it. In the thief sampling paradigm, process control is based on statistical analyses, and most statistical analyses are based on the implicit assumption that Gaussian or normal population statistics govern the process. In-line studies provide direct evidence for whether this assumption is true. If the assumption is not true, a much more sophisticated form of statistics must be applied, but even then, it must be assumed that the statistics will not change over time.
Because in-line measurements sample a far larger portion of the product than the standard procedure, assumptions about the statistical nature of the process are unnecessary. In the same period that a single thief sample is measured and reported, the SpectrInLine makes approximately 500,000 measurements. Based on these data, it is possible to use autocorrelation analysis and other tools to show that product composition is not distributed normally. In the case shown in Figure 3 dealing with the moisture content of pet food, the product line exhibited a Lorentzian distribution—that is, variations from the average could have been much greater than those expected from a statistic such as a standard deviation.
|
Figure 4: Process control involving the high-speed drying of a powder shows moisture measured in 1-second intervals. |
Some chemical processes occur too rapidly for any type of process control sampling to be effective. In the example illustrated in Figure 4 on the high-speed drying of a powder, the SpectrInLine was used to test a product with a drying time of approximately 40 seconds. A sample result was obtained on five successive drying cycles over a period of about 4 minutes. The SpectrInLine averaging time was reduced to 1 second for this analysis, and the appearance of noise in the data resulted from very-high-frequency events in the dynamic dryer. Measurement noise was on the order of the width of the lines in the figure. In cases such as this, it is possible to consider closed-loop feedback to maintain a consistent product despite the high speed of the process.
The SpectrInLine systems’ rapid response enables them to perform closed-loop feedback control of processes such as drying. In the pet food example shown in Figure 5, closed-loop operation was able to maintain a moisture concentration just below the upper control limit with an accuracy of ±0.3% without human intervention.
Conclusion
|
Figure 5: Operation of a closed-loop feedback controller based on SpectrInLine process measurements |
Optical monitors for composition analysis of manufactured products are at a turning point. Old-style instruments based on photometers and spectrometers have great strengths, but they also have weaknesses that make it difficult to use them for on-line measurements. Multivariate optical computing, however, combines the best attributes of both photometers and spectrometers, enabling real-time measurement like never before.
Optical instruments make it possible to eliminate much of the human and statistical error associated with thief sampling of process streams, and they make it possible to obtain a much deeper understanding of manufacturing processes. In addition, they can be used to obtain immediate diagnostic data on the mechanical, electrical, or hydraulic conditions on a product line. They provide much-improved statistics for blending, drying, mixing, and many other processes so that product composition can be optimized. Product optimizations can enable manufacturers to conserve costly ingredients, increase the average content of less-costly ingredients, reduce waste, improve product shelf life, and eliminate rare but costly events that can occur when product is substantially off specification. Energy costs can also be reduced, while facility utilization can be increased.
The wealth of data provided by real-time measurement provides the corporate office, plant managers, and quality assurance personnel with an opportunity to make economic comparisons between different plants, different lines in the same plant, different dryer types, different processing environments, different shifts, and even different operators. If questions arise with future users or regulatory agencies, databases containing historical information on product runs can provide evidence that products were in specification at the time of production. Taken together, the rationale for performing real-time measurements on manufactured products includes achieving readily calculatable returns on the initial investment as well as quality assurance improvements.
Michael L. Myrick, PhD, is the founder and chief scientist of Ometric Corp., a company that enables manufacturers to embed analytical technology into their industrial processes. Myrick is an associate professor of chemistry at the University of South Carolina in Columbia. His group designs, constructs, and tests MOEs and continues to develop new theories and applications for them. Myrick received a PhD in physical chemistry from New Mexico State University at Las Cruces and a bachelor’s degree in chemistry from North Carolina State University. He can be reached at 803-777-6018 or [email protected].
About the Author(s)
You May Also Like
Editor's Choice

.svg?width=800&auto=webp&quality=80&disable=upscale)