May 13, 2020
The importance of creating, moving, and packaging solid products has often taken a back seat to complex upstream reaction, separation, and purification operations. While often easier to conceptualize, keeping solids handling processes operating efficiently can be quite difficult. Solid particles tend to clump, agglomerate, and plug—requiring manual intervention to address line outages. The transfer and packaging of solid products often involves more human to product interaction than all other processing steps combined. This can lead to a host of production, safety health environmental, and quality vulnerabilities.
These highly mechanical finishing processes are also often poorly instrumented. However, the rise of wireless network infrastructures has made sensor installation affordable, and as a result many plants have more data in these areas of the process than ever before. Self-service advanced analytics software helps front line personnel easily visualize and analyze data from new and existing sensors, and from other online and offline sources. Self-service advanced analytics software empowers subject matter experts (SMEs) to perform complex analytics techniques with a point and click user interface, without having to code complex algorithms.
The availability of data and applications to understand it means SMEs can identify recurring scenarios and prescribe ways for operations to remove process bottlenecks, without the need for capital-intensive modifications to existing plant equipment. This capability is fueling a better understanding of how this equipment operates and impacts on equipment availability, product quality, and maintenance costs.
This article highlights pain points in common industry operations related to solids handling and identifies opportunities for the application of SME-driven advanced analytics to generate collaborative, scalable solutions.
Complex Problems and Insufficient Insights
Process finishing and packaging engineers have traditionally spent a good deal of time fighting fires pertaining to production, reliability, and quality issues. Many of the production (line stoppage) and reliability (maintenance) problems are a result of a run-to-failure mindset amidst a continuous stream of expensive, single-point-of-failure assets. This is the old status quo in a data-poor environment.
For example, product extruders and dryers are prone to trip from upstream process upsets if timely compensating action is not taken. Solids conveyors lose tension gradually over time, then fail exponentially and beyond repair without periodic tensioning procedures. Solid particulates stick to transfer surfaces and to each other, causing fouling and plugging of gravity-driven transfer lines and chutes. These types of events typically cause prolonged line stoppages, inefficient use of maintenance resources, and rush delivery of mechanical parts.
Another example occurs when complex integration between unit operations, with limited surge capacity, often results in a process trip or run-to-failure approach without an immediate recovery to operation, causing upstream units to shed production rate or shut down completely. This issue can be addressed with conservative time-based maintenance strategy, but this is an expensive fix. Without adequate data to tell them exactly when a failure should be expected, this frequent but planned maintenance activity was the best scenario plants could hope to achieve.
In addition, there are the product quality vulnerabilities present in product finishing and packaging areas. Rotating equipment fatigue and failure in these closed-loop systems can cause product contamination. Changes to product bulk density may result in over or under weight product packages. Without historized data and the tools to analyze it, a customer complaint for metal contamination could result in downgrading thousands of pounds of material produced on either side of the suspect packages production timestamp.
These and other issues could theoretically be addressed by intelligent analysis of data typically stored in process historians and other databases. But with historized data now available, the challenge has shifted from not having enough data to not having the right tools to create insights in a timely manner.
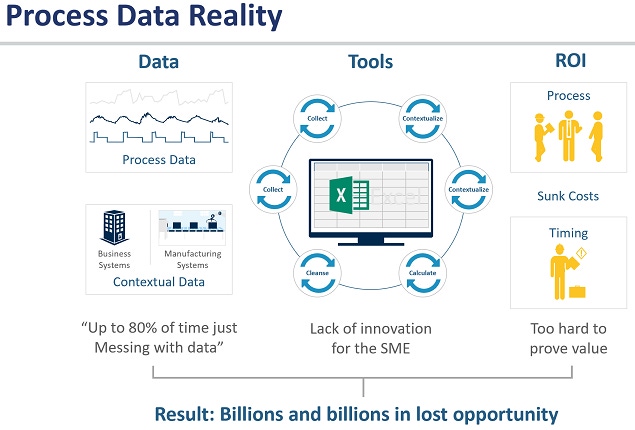
Until now, data visualization and analysis has been confined to a given historian’s trending tool and a spreadsheet add-in. Monitoring critical calculated process parameters is still being done with spreadsheets, with no live connection to the process data historian, making “real-time” monitoring extremely limited (Figure 1).
This approach left major gaps in the areas of data alignment, contextual data source integration, computational performance, knowledge capture, and collaboration. An analysis with any degree of complexity is only as good as the ability to develop it quickly and iteratively, and then present it to different audiences in varying levels of detail, requiring improved analytics software.
Enter Advanced Analytics
Self-service advanced analytics software addresses these gaps with a browser-based application that makes data from a variety of data sources available to the SME in a single environment (Figure 2). The application runs on its own server, so a user’s analytics capability is never limited by the number of rows in a spreadsheet or the hardware specs of a PC.
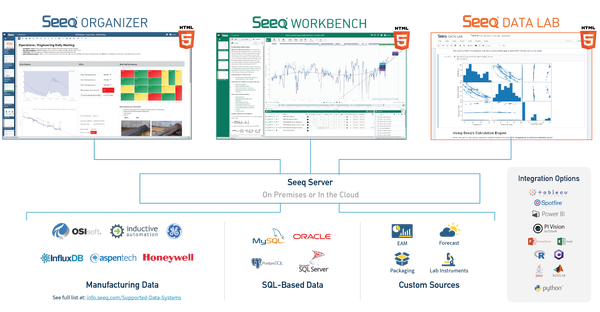
Workbench gives SMEs the capability to analyze data from multiple data sources over any historical or live-updating time window. The data can be analyzed using a suite of point and click tools to help the user identify periods of interest in their data, calculate KPIs, build golden monitoring profiles, and calculate multivariate models.
Conditions and Capsules are used to zone in on specific time periods of interest for calculation, monitoring, or model training. Once an analysis has been built for a single asset, it can be applied elsewhere using asset trees. These asset trees can be imported via connection to other asset hierarchy systems, or SMEs can create their own asset hierarchies tailored to a specific site, business line, or use case (Figure 3).
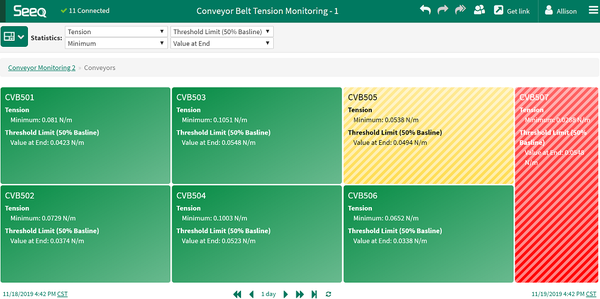
Figure 3: Scaling an analysis across multiple similar assets
Organizer Topics enable SMEs to compile content from all their different Workbench Analyses into a single visual dashboard or report. Topics are shared as browser links, where users can open an editable, read-only, or presentation view. The content embedded in a Topic links back to the underlying Analysis worksheet, so SMEs can dive deeper into an investigation directly from the Topic.
The browser-based nature of these applications fosters collaboration in many forms. Each Workbench Analysis contains a journal where SMEs can document their analytics workflow by dropping links to trend items, date ranges of interest, or complete work steps. SMEs can jointly build out an Analysis or Topic, with the ability to see edits made by their peers in real time.
Collaboration amongst personnel at one or many sites is therefore facilitated, with data integrity and security maintained. Integrated security features allow enterprises to set data source level permissions, ensuring users only have access to the data sources they would typically access from their production site. Calculations can be shared at the item level, eliminating the need for multiple users to do the same calculation multiple times. And user access groups can also be inherited from enterprise systems like Active Directory to make sharing content amongst workgroups quick and effective.
Use Cases Demonstrate Advanced Analytics Effectiveness
Bulk solids manufacturers have used self-service advanced analytics software for root cause analysis, near real-time modeling and monitoring, forecasting, prescriptive analytics, and other issues. Use cases detailed in this article include extruder shutdown investigation and start-up profile development, bulk density modeling for near-real-time monitoring and optimization, and forecasting end of life behavior of conveyor belt assets.
Extruder Shutdown Investigation and Start-up Profile Development
* Challenge: Extruder shutdowns can occur with little warning, and a failure to restart in a timely manner can consume process surge capacity and result in a shutdown of upstream equipment. In the worst case, material hardens inside the extruder, requiring an extended shutdown for disassembly and manual removal of the material. Understanding the cause of a shutdown is imperative to making long-term process improvements. Knowing what constitutes an ideal start-up is critical to minimize failed restarts.
* Solution: Conditions in the self-service advanced analytics software were created for extruder shutdowns and restarts. The data immediately prior to all shutdowns was examined to identify the root cause of each shutdown. Successful restart criteria were defined and used to curate a subset of the restart capsules for golden profile development.
* Result: Utilizing the ideal restart profiles as extruder start-up guidelines has significantly decreased the average number of restart attempts following an extruder trip. Preventing a single upstream unit shutdown is valued at $80K.
Bulk Density Modeling, Monitoring and Optimization
* Challenge: Changes to the bulk density of a packaged bulk solid can result in a variety of packaging and supply chain quality issues. The costliest of these problems is the creation of overweight or underweight packages. Most often a bulk density shift is realized at the bagging line, where the same size package suddenly yields an underweight or overfilled bag or box. Packages of incorrect weight are downgraded and sold at a reduced price, resulting in hundreds of thousands of dollars a year in lost margin.
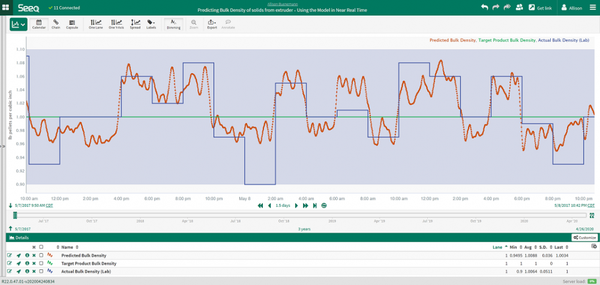
* Solution: A model of bulk density was created based on upstream process conditions (Figure 4). Process sensors were used as proxies for lab measurements like material crystallinity, density, and particle size—each of which are highly correlated with bulk density. By putting the model into action, packaging engineers and operators can foresee bulk density swings before they occur, allowing them to make proactive package size adjustments to prevent production of off-weight packages.
Figure 4: A prediction of a solids bulk density was developed by identifying highly correlated upstream process variables by calculating a regression model in Seeq’s self-service advanced analytics software.
* Result: A large polymer manufacturer created and validated the model against historical bulk density measurements. When they operationalized model-driven package size decisions they were able to reduce the number of off-weight packages created by 50%, resulting in an annual margin improvement of more than $50k.
Conveyor Belt Tension Maintenance Forecasting
* Challenge: Conveyors are a key product transfer asset for bulk solids. Manufacturers may have tens or hundreds of these assets, making it impractical to perform routine maintenance on each of them. This often results in a combination of run-to-failure and time-based maintenance strategies. Run-to-failure strategies are costly due to resulting prolonged line outages and required reactive maintenance. Time-based strategies can result in unnecessary maintenance, tying up valuable mechanical resources and increasing the risk of induced problems.
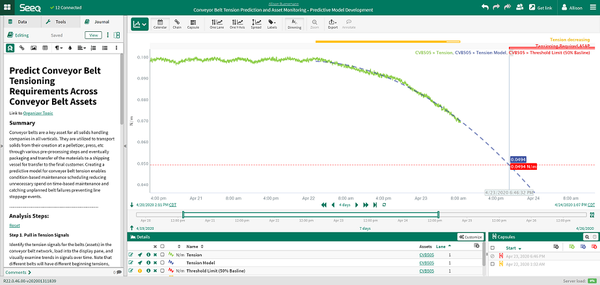
* Solution: Develop a robust condition monitoring technique to detect end-of-life behavior in the tension signal (Figure 5). Use modeling techniques to create a forecast of the tension to identify the required maintenance date and schedule mechanical resources accordingly. Use asset tree functionalities to scale the analysis across all conveyor assets and ensure only those assets requiring immediate maintenance are serviced on a given day.
Figure 5: A forecast of end-of life-conveyor belt tension was generated using Seeq’s self-service advanced analytics software by identifying a persistent negative rate of change in the tension signal.
* Result: Implementing a strictly condition-based maintenance strategy at a large mineral processing facility resulted in annual savings up to $1M in lost opportunity and a reduction in annual maintenance expenses of up to $100K.
Conclusion
Solids handling problems require new solutions to quickly create insights from the data typically available in process historians and other databases. Traditional general-purpose tools, such as a historian’s trending tool and a spreadsheet add-in, are not up to the challenge due to inherent limitations. Advanced analytics software designed specifically to create insights from time-series data addresses issues found when using traditional tools, providing SMEs with the ability to quickly examine problems, create solutions, and share results.
Allison Buenemann is an analytics engineer for Seeq Corp. (Seattle, WA). She has a process engineering background with a BS in Chemical Engineering from Purdue University and an MBA from Louisiana State University. Buenemann spent her early career with ExxonMobil Corp., working in polymers manufacturing units where she gained experience with many different bulk solids processes including extrusion, pelletization, pastillation/rotoforming, flaking, drying, transfer, bagging, and baling. In her current role, she draws on her manufacturing expertise to provide Seeq Advanced Analytics solutions to customers in all process industry verticals. For more information, call 206-801-9339 or visit www.seeq.com.
For more articles, news, and equipment reviews, visit our Instrumentation & Control Equipment Zone
Click here for Instrumentation & Control Equipment Manufacturers
You May Also Like


