


Sign up for the Powder & Bulk Solids Weekly newsletter.
December 5, 2007
9 Min Read
.svg?width=850&auto=webp&quality=95&format=jpg&disable=upscale "On-line Particle Size Analysis in Toner Production")
|
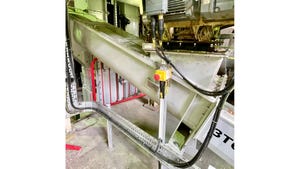
Insitec on-line particle size analyzer |
|
Figure 1: Particle size distribution correlation between the particle counter and the Malvern Insitec D50 output classifier |
|
Figure 2: Particle size distribution correlation output classifier sampling of line 4 for D50 |
In the toner industry, there is a long-standing trend toward manufacturing products with a smaller particle size. Smaller particles, while more challenging to handle, are necessary for enhanced print resolution. A resolution of 600 dpi, for example, requires a toner particle size of approximately 8 µm. While the mean size of toner particles five years ago was about 11 µm, the current mean size is approximately 8 to 9 µm. This trend seems likely to continue, so that by the end of the decade it is expected that the average toner particle size will be between 5 and 6 µm.
Toners can be manufactured by milling extruded toner pellets that are produced from a polymer blend incorporating pigments and other additives. Controlling this milling process to meet customers’ increasingly demanding specifications is a challenge. Underprocessing, which can lead to the presence of large particles or excessive fines, compromises product quality. On the other hand, overprocessing is costly, since milling is energy intensive. An added complication is that with decreasing particle size, the dispersion process associated with conventional particle-sizing techniques becomes more arduous, making the analytical procedure more time-consuming.
At Toshiba Dieppe, toners are produced on a series of parallel milling lines. To improve the control of these lines and decrease the analytical burden associated with increased control, the company has invested in a pair of Insitec systems from Malvern Instruments. The first of these on-line laser-diffraction particle size analyzers was installed in 2001 and the second in 2004. A third installation is planned.
Operation at Toshiba Dieppe
From 1993 to 2000, particle size measurements were taken once an hour at Toshiba Dieppe. The shift supervisor used a Panorama supervisory control and data acquisition (SCADA) system to control the process by manipulating parameters such as pressure, rotor speed, mill feed rate, and current. Historically, the supervisor was inundated with information on which to base process changes. Subsequently, a change in philosophy limited the control parameters to the most relevant variables. These variables included the particle size output from the process, the finished particle size being a function of all the process parameters recorded by the Panorama software.
In 2001, the company took delivery of the first Insitec on-line laser-diffraction particle sizer, which was installed on parallel lines 3 and 4. When it was clear that this system functioned successfully, a second instrument was installed in 2004 on line 1. Future planned plant improvements include the purchase of another unit for a new line known as TLC 1. A key part of accepting the new technology involved ensuring that the different Insitec systems produced identical data and that the data were consistent with those from the analytical techniques used previously.
Improving Data Quality
|
Figure 3: D50 correlation between the two Insitec systems at the Dieppe plant |
|
Figure 4: Time history log |
It was important for Toshiba to correlate laser-diffraction analysis with the historical measurement techniques used in the toner industry. When the Insitec laser-diffraction system was compared with the particle counter already in use, most discrepancies were attributed to the counter’s dispersion problems.
Sample preparation of stickier products is a lengthy process because these materials are difficult to disperse using the particle counter’s wet method. As the fineness of toner particles has increased, the particles have become more cohesive and more difficult to disperse. In order to overcome increasingly challenging dispersion problems, Toshiba Japan first invested in an ultrasonic tank in 2000 and then shifted to a tank in 2002 that is twice as powerful. Currently, the company is considering purchasing a tank that is 10 times more powerful than the current one.
In addition to dispersion problems, some statistical error was attributable to the small quantities of sample material that the particle counter’s electrosensing zone technique requires to perform measurements. The Insitec system does not cause such errors because it measures much larger sample volumes that are statistically representative of the process. Furthermore, the system incorporates a multiple-scattering software correction that makes it less sensitive to variations in sample concentration. Accurate measurements can be obtained when the unit operates at obscurations ranging from 50 to 90%.
Correlations
|
Figure 5: Screen capture of a time history log showing the most modern line with a reduced standard deviation |
|
Figure 6: Evolution of particle size distribution |
|
Figure 7: Reduction of particle size distribution |
To establish a good correlation between the Insitec system and the counter, a correlation (not dependent on individual products) was developed over a relatively broad particle size range of 8 to 12 µm. The refractive index and the absorption coefficient were especially important parameters to determine because they can affect the percentage of fines. The Insitec system provides a volume result that has to be transformed into a number distribution as provided by the counter.
Figure 1 shows that the correlation between the two techniques is independent of the type of product, process mill (NPK or Alpine), and even the sampling point. The graph shows an excellent correlation (0.97) for the median diameter (D50) between the Insitec and the counter.
Figure 2 shows the correlation for the percentage of particles below 5 µm. At 0.93, the correlation is still very good. Out-of-specification material is defined as less than
5 and greater than 20 µm. Which parameter was the most relevant to control the classifier? In fact, the 10% diameter (D10) is used to control the classifier and the 90% (D90) diameter is used to control the air-jet mill.
The opportunity was also taken to compare the correlation between the two Insitec particle sizers at the Dieppe plant (Figure 3). At 0.9953, the correlation was excellent, although one of the two units belongs to an older generation.
Once the correlation with the counter was established, it was possible to transform the Insitec result into values equivalent to those obtained in the past with the particle counter. Toshiba expects to replace the counter measurement with an average value of the median diameter obtained using the Insitec over the total duration of the batch production.
The resulting reduction of sample measurement time in the laboratory has made it possible to release operators for production tasks. Before the Insitec system was introduced, one operator spent 70% of his time taking samples and performing analyses. Reducing the number of lab analyses was particularly valuable because of analysis times were expanding.
Operating with On-Line Analysis
A direct result of integrating the particle sizer has been to reduce the number of process adjustments on the production line by a factor of three. The sample dispersion problems had a direct influence on the results obtained using the counter. The data variability stemming from these problems resulted in having to make unnecessary adjustments to the production parameters. Consequently, before the Insitec system was implemented, the process parameters were adjusted once or twice per shift. Now, adjustments are made only once or twice a day.
Moreover, after an adjustment has been made, it is no longer necessary to wait two hours to see its effect. The result is immediately visible on the time history log that depicts the process variables (Figure 4). In this example, the blue line representing the median diameter (D50), while within specification, was a little low. Hence, the shift supervisor decided to readjust the mill rotor speed, increasing the median particle size while maintaining it within specification. The process change also increased toner output by 0.2 to 0.3%.
Even more interesting is Figure 5, which represents the most modern line equipped with an Alpine air-jet mill. In this case the Dv(50) upper specification limit was 10.7 µm and production was controlled at 10.66 µm—that is, just 0.3% below the maximum limit. The on-line system has enabled the line to achieve such tight tolerance because it has improved process control. Maintaining tight specifications leads to important energy savings and higher production throughput.
Figure 6 represents the evolution of the average particle size before and after the installation of the on-line particle sizer. With range limits set between 10.5 and 11.5 µm, the mean particle size achieved using the particle counter was between 10.8 and 11.1 µm. After the new system was installed, the average particle size achieved has been between 11.2 and 11.35 µm, increasing throughput of just-in-specification product. As shown in Figure 7, this improvement was made possible by reducing the particle size standard deviation. While the standard deviation for the median diameter (D50) was
0.22 before on-line control, it was lowered to 0.15 after the installation.
Overall, the factory has achieved a 1% increase in toner output as a result of the process control upgrade. In addition, line blockages can be anticipated, and a threshold has been established that warns of the need for maintenance action. Finally, the on-line system has enabled the shift supervisor to detect process errors immediately, enabling him to respond quickly to events that can cause overgrinding.
Malvern Instruments, Westborough, MA, is a leading supplier of advanced analytical systems that deliver particle, rheological, and chemical composition data essential for characterizing a wide variety of materials. For more information, call 508-768-6400 or visit www.malvern.com.
You May Also Like
Editor's Choice


.svg?width=800&auto=webp&quality=80&disable=upscale)