September 12, 2018

Anyone who works with powder and granular products quickly learns how these materials can misbehave. Some have almost liquid-like characteristics, but most tend to form clumps, especially when stored in large quantities. When this happens, they resist flowing, tend to clog pipes and ducts, and create uneven distribution in storage vessels. A view from an inspection port may reveal mountains and gullies near filling and emptying ports, which can make accurate determination of a vessel’s contents extremely challenging.
Selecting a level-measuring technology for a product that does not naturally spread evenly poses some interesting tradeoffs. Several approaches using non-contacting or guided wave radar can provide accurate spot readings, but they do not have the ability to overcome the unevenness often found on the product surface.
But there is one level- and volume-measuring technology capable of creating an accurate picture of a silo’s contents, regardless of complex interior terrain: acoustic transmitters using phased-array antennas. These instruments can perform sophisticated mapping of the product surface in a vessel (Figure 1). After sending sound pulses in different directions at three different frequencies, the antennas receive multiple echo signals from the walls and contents. Using these integral antennas, the scanner continuously measures the direction and distance of each echoed signal and generates a coordinate of the echo inside the vessel.
Digital signal processing within the instrument samples and analyzes the echoed signals to produce accurate measurements of the level and volume across the entire surface (Figure 2) within the wide beam angle of the device. Especially large storage environments may require more than one unit working together, but a single acoustic transmitter can cover a large area.
For many applications, this kind of measurement is far more conclusive for purposes of inventory determination than any single point level reading. Yet as sophisticated as this technology is, there is more it can do. The same analytical platform capable of creating the 3D image of the material’s distribution can look more deeply into what’s happening inside the vessel.
Understanding Weight Distribution
When product accumulates unevenly, the weight, naturally, is also unevenly distributed. Products that tend to bridge or stack concentrate weight as well as volume, which can cause problems and even vessel collapse in extreme situations. For products where this is a constant problem, most vessels will have some mechanism to break up the formations. The more problematic situation is where the product clumps intermittently, such as when humidity is excessively high. Operators may not realize when internal blockages are forming, and a filling or emptying cycle may trigger an incident. Two types of configurations are particularly susceptible to this problem: vessels on legs and silos built of concrete.
Most storage vessels unload from the bottom, taking advantage of gravity to make the job easier. As a result, many are raised on legs to get them above whatever vessel is receiving their contents. When these structures are being designed, there is a tradeoff between strength and cost. The supporting legs need to have a reasonable safety factor, but sometimes circumstances change and the vessel may not be used in the way originally planned. If the product forms a large deposit on one side of the vessel, too much weight may be concentrated over one leg, causing the vessel to sag or collapse. All the weight concentrated in one area may shift and cause the vessel to fall over.
Old concrete silos also can be susceptible to damage or collapse due to deterioration of the concrete walls combined with poor weight distribution. Where replacement isn’t practical, an aging silo may still be used regularly but de-rated, so it is not filled to its original capacity. If the product tends to accumulate on one side, it can cause excessive wall loading because the vertical wall loading caused by the friction effect of the product can combine with the horizontal wall load pressing out. Both are concentrated at the bottom, and if severe enough, may cause a breach by pushing the wall out. This can happen even though the contents of the silo are within the de-rated limitations.
Avoiding this kind of incident depends on keeping the contents centered so weight is distributed evenly. This helps manage both the horizontal and vertical wall loading, and the weight borne by individual legs. One approach with raised vessels is adding a load cell under each leg. This technique is usually used to monitor the vessel’s contents, but with appropriate software to compare the measurements from each load cell, it can determine if the center of gravity has shifted too much to one side. This technique tends to be very expensive to implement, particularly when retrofitting an existing installation. It can provide an accurate measurement of the vessel’s contents by weight along with its distribution, but it can’t identify how product is flowing through the vessel and where it might be stacking, and it won’t yield an accurate volume measurement if product density varies.
Watching Weight Distribution
When outfitted with the appropriate software, an acoustic transmitter using phased-array antennas can analyze the mapping of the vessel’s contents with enough detail and precision to calculate the center of gravity (COG) for the contents (Figure 3). Since this is a dynamic, real-time measurement, it is possible to determine where problems are developing during filling and emptying cycles. An alarm can be set to alert operators if the COG shifts outside an allowable region. Technicians can change the filling method or may have to take more direct actions to break up large formations of material before they block flow or create an internal collapse.
Mapping Product Movement
When looking at large storage vessels (huge silos, warehouses, domes, etc.), material formation becomes even more chaotic and can endanger people and equipment as well as prevent optimal usage of the vessel, as it is difficult to identify peaks and valleys created by filling and emptying cycles.
An acoustic transmitter using phased-array antennas can spot formations, and with the right software it can also monitor product movement. An analytical capability called virtual sections (Figure 4) allows an operator to “split” the vessel into as many as 99 sections. For each section the software will provide the minimum, maximum and average level of material allowing optimal control of material distribution and risk prevention. This type of analysis is particularly important for large, warehouse-sized storage facilities as opposed to typical silos. For example, an acoustic transmitter can be used to monitor a large coal bunker installation’s filling and emptying actions for optimal movement of the tripper car and efficient usage of silo bunker’s capacity.
Accurate Measurement Supports Inventory Control
Outside of aging wine or whiskey, there are few areas where it is desirable to have inventory sitting on the shelf. This certainly applies when dealing with bulk products, but many companies end up holding high amounts of safety inventory to avoid production problems since they have difficulty measuring what is actually on hand. This may be tolerable if the product is cheap enough, but if it is expensive – such as pellets of an exotic polymer used in injection molding or perishable such as foodstuffs – effective inventory control is critical.
In some situations, it may be practical for vessels to be mounted on load cells, but this is costly and only works with certain types of storage vessels. Other applications may use conveyor scales, but these are only suited to specific equipment configurations and tend to be maintenance intensive.
Acoustic transmitters using phased-array antennas can generate an accurate measurement of the volume of the contents in a vessel or even bulk materials piled on the floor of a warehouse. Since the reading is dynamic, it can be used to measure product movement during filling and emptying cycles or to watch a slower product flow into a continuous process during whatever period of time is necessary. (See Sidebar)
The versatility to read volume accurately, help maintain inventory management and even support safety efforts explains the growing interest in acoustic transmitters using phased-array antennas for solids measurement and characterization. When combined with sophisticated analytical software, the result can solve problems and provide rapid return on investment.
SIDEBAR: Keeping a Handle on Spar Consumption
The Chemours plant in LaPorte, TX, manufactures hydrofluoric acid. The two main feedstocks used in the process are sulfuric acid and calcium fluoride. Bulk amounts of calcium fluoride are extracted from mines where natural deposits are called fluorspar, or simply “spar.” As powders go, spar is relatively easy to work with. It isn’t sticky, doesn’t absorb atmospheric moisture, and flows readily. On the other hand, it’s dusty and abrasive.
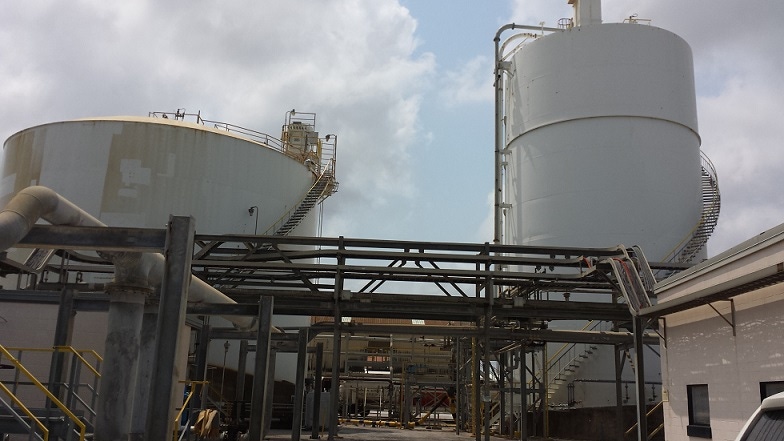
After drying, spar goes into one of two storage silos (see photo) in the hydrofluoric acid production unit. While the spar going into the process is weighed, the conveyor weighing mechanisms don’t have the required precision. There is also the question of how much spar is on hand in the two silos at any given time.
For many years, the inventory-measuring process was manual, sending an operator up the stairs to the tank roof, opening a specific nozzle, and lowering a tape measure to the product surface. After trying a variety of techniques to make the process more consistent or automated, Chemours found spot level readings could not overcome one key inadequacy: the inability to determine the contour of the product surface across the interior of the silo.
While spar does not exhibit some of the more severe buildup characteristics of stickier powders, it does still develop level variability throughout the silo. Moreover, the manual measuring position in each of the two silos, relative to the filling and emptying ports, is different. On the north silo, the manual reading was assumed to be high because it was the farthest away from the emptying port. The south silo created the opposite effect since the measuring point was much closer to the emptying port.
The solution able to deliver on all counts proved to be a completely different technology. Chemours discovered the Rosemount 5708 3D solids scanner acoustic phased-array instrument. It installed one as a test on the north silo and began testing it against the traditional manual measurement method.
Once Chemours was satisfied with the accuracy and repeatability of the measurements, company management began using the data for accounting purposes to monitor spar usage after the drying stage. Given the cost of spar and the volumes involved, an error as small as 0.5 percent persisting throughout a year’s time amounts to more than $250,000, so more accurate inventory has the potential to produce considerable savings.
Using a strategy of shifting the filling and emptying steps from silo to silo, it became a simple matter to create a more precise picture of spar consumption than was provided by the conveyor scales. This made it much easier to explore ways to optimize the process further and provided more conclusive financial data.
Andrew Foust is solids level business development manager for North America at Emerson Automation Solutions. For more information, visit www.emerson.com/en-us/automation-solutions.
For related articles, news, and equipment reviews, visit our Storage Equipment Zone
Click here for a List of Storage Equipment Manufacturers
You May Also Like

