July 18, 2016

A weigh belt feeder is a device that can control the rate at which a bulk material is metered into a downstream process by weight rather than by volume.
A weigh belt feeder normally is equipped with a weight-sensing device such as a load cell, as well as a belt travel device such as an encoder. These instruments send data to a process controller that then calculates live process values, including the actual belt load, belt speed, and feedrate of the material.
The process controller calculates a deviation error between the actual feedrate and the desired feedrate (setpoint). The deviation error is used to calculate a control signal output for the belt speed. The belt speed is varied to maintain the desired feedrate (setpoint) of material into the downstream process.
The belt speed must be constantly varied to maintain the desired setpoint in order to compensate for bulk density variations of the material.
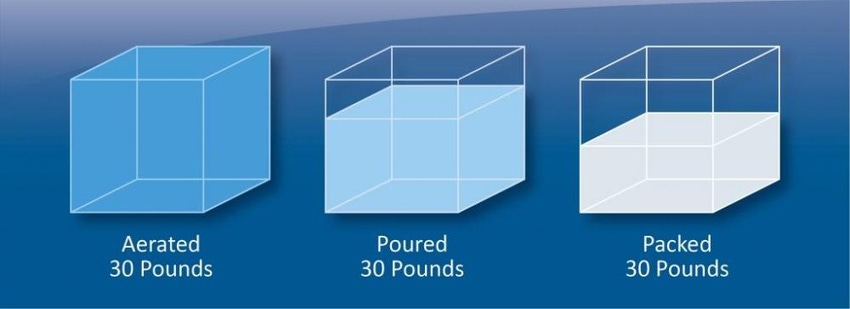
Factors Affecting Bulk Density
The bulk density of a material is the weight per amount of volume occupied. Pressure, acceleration, aeration, hopper shape, particle size, etc., can all affect the bulk density of a material. This in turn affects the weight of a material at various points in a production process.
(see graphic 1)
Connectivity using a Network
The process controller for a weigh belt feeder can be connected to another intelligent device like a PLC in order to exchange data and status signals for better integration into the overall plant system. Historically, the process controller would have been connected to a PLC by hard wired signals. However, in recent years, the fastest, most efficient and most economical way to connect a weigh belt feeder controller to a PLC is using an industrial network such as Profibus or Ethernet/IP.
The advances in network technology have expanded the usefulness of the data generated by a weigh belt feeder system. Now most process values can be monitored by a plant control system or PLC in order to monitor more detailed information on the performance of the feeder and current material characteristics.
Online Process Control Monitoring
How well a weigh belt feeder is performing (maintaining control of the material feedrate) can be continually monitored using process data from the controller, the data can be compared to benchmarks established during correct operation of the weigh belt feeder. If the data shows that the control of the feedrate is outside of the limits established based on previous data collection an alarm can be generated. This allows more intelligent detection of control problems potentially avoiding the production of off-spec products.
An example of this is comparing a specific time period and the setpoint to the process control totalizer. For example:
Time Period: 5 min
Setpoint: 5 lb/min
Starting Total: 2308.2 lb
Ending Total: 2333.1 lb
Calculated Feedrate: 4.98 lb/min - (2,333.1 – 2,308.2) /5 min
Error in Feedrate: - 0.4%
Note that this method can be used even if the calibration of the feeder is not ideal. Because the totalizer and feedrate values are based on the same calibration constants, the percentage deviation from Setpoint is still valid. Gross errors in the feeder calibration and weighing system hardware can cause unreliable results using this method.
A more general check of the operational status of a weigh belt feeder is to simply monitor the Belt Speed in relation to the setpoint. Monitoring this data over time can help establish the relationship between the belt speed and the feedrate/belt load at different setpoint values.
Then the comparison can be made using current belt speed and setpoint to ensure no process shift has taken place which could negatively affect the weigh belt feeder control of the material. Items that might be considered a process shift could include variation in the bulk density, component failure (load cell or encoder), or poor flow of material through the feeder.
Graphic 1 can be constructed from live data monitored while the weigh belt feeder is operating and performing correctly. The resultant belt speed versus feedrate curve can be used to determine an optimal belt speed for any feedrate. A deviation between the optimal belt speed and the actual belt speed can be calculated and compared to pre-established limits. If the limit is exceeded, then an alarm can be generated.
For example:
Current Belt Speed: 22 ft/min
Current Feedrate: 860 lb/min
Ideal Feedrate: 880 lb/min (800 + ((2 / 5) x 200))
Deviation from Normal: 2.27% ((880 - 860) / 880 x 100)
Online Bulk Density Monitoring
It is sometimes beneficial to know a rough bulk density of a material as it is passing through a process. Mixing and blending accuracy, as well as changes in moisture content, can sometimes be actively monitored using a weigh belt feeder. As with calibration, break points can be established in order to generate an alarm under abnormal conditions.
The belt speed versus feedrate example previously mentioned is one method of detecting changes in bulk density, but does not quantify the actual bulk density value. Each of the two following methods assumes a fairly consistent profile of material on the belt. This means that the shape of the material on the belt that the material forms has roughly the same dimensions all the time. This also assumes that if there are breaks or voids in the material form on the belt, they stay relatively uniform.
The first method quantifies the volume of material that is carried by the belt each linear foot. This can be established by running the belt until it is full of material. The belt load value should be recorded as shown on the process controller. Then collect material from the belt equal to one linear foot and place it into a vessel. The volume occupied by the one linear foot of material can then be determined. Using the volume of material and the Belt Load Value a rough conversion factor can be calculated.
For example:
Belt Load: 3.5 lb/ft
Volume: 0.28 cu ft
Dens Factor: 3.57
Bulk Density: 12.5 lb/cu ft
The second method is to calculate the area of a slice (cross section) of the material profile on the belt. You can measure the actual dimensions of the material profile and use a standard area calculation for a trapezoid or other shape. The area in inches is then multiplied by 12 (inches) to arrive at a volume per linear foot of material.
For example:
Width1: 6 in.
Width2: 8 in.
Height: 3 in.
Area: 21 cu in. (6 + 8) / 2 X 3
Volume: 0.146 cu ft (21 x 12 / 1728)
Dens Factor: 6.85
(see Graphic 3)
Note that bulk density calculations are not exact and rely on the material flow consistency as well as good weigh belt feeder design. However, the data collected can provide a numeric reference for bulk density while the weigh belt feeder is in operation. This allows for historical trending which can establish where alarm points for bulk density could be set.
Conclusions
Monitoring of real time data from a gravimetric weigh belt feeder is often used minimally or only for short term troubleshooting. However, enhanced data collection can be used for more advanced calculations and status checks to provide not only a more complete picture of the weigh belt feeder performance, but also information on the materials being fed and the process before and after the feeder. As with most processes, the material characteristics and feeder design are a large factor in the success of enhanced data monitoring techniques.
Steve Musser is VP process industries for Merrick Industries Inc., Lynn Haven, FL. He has been involved with weighing and gravimetric feeding for more than 25 years. For more information, visit merrick-inc.com.
For related articles, news, and equipment reviews, visit our Feeders Equipment Zone
Click here for a List of Feeder Manufacturers
You May Also Like


